
The Brownlow medal is one of the most intriguing nights on the football calendar.
With the assistance of statistical analysis we can at very least begin to break down the areas in which point an aspiring medalist in the right direction throughout their season. So let’s think about this rationally: when you think about stats in a game, what are those that stand out the most? The most obvious answer is possessions, the more touches you rack up the more imposing your performance will be rated. After that? Marks and tackles are those you see on a basic stat sheet, so you’d assume that they would be the next highest rated.
There’s so many questions and old wives tales that hover over the night, my personal favorite is the “If a player gives away more free kicks than they receive, does that put them in a favorable light to the umpires come voting time?” and the timeless classic: is the Brownlow Medal a midfielders medal?
The most famous of all statistics is the humble possession. Kick, handball, otherwise you name it, it matters. Let’s look at the history, every single Brownlow medal winner from 2010 to present day has averaged over 27 possessions. These numbers instantly suggest that midfielders always get the better end of the deal, due to the fact that there is scarce few forwards in history that have ever averaged that. Trends of the Brownlow also evolve as the game changes. As the game has become a more contested slug in the last couple of years, those judged the best and fairest each year have averaged more tackles than years past. Excluding Dane Swan in 2011 (3.2 tackles), the lowest tackling average was 4.3 and got as high as 7.3 in Matthew Priddis’ successful 2014 campaign. Despite average possessions evidently being an extremely important aspect in the long run, it is an interesting trend that suggests that winner of the Brownlow medal in years 2010-2015 were NOT the leading possession gatherers in their respective years, which goes to show that that (rightfully) is not the be all and end all.
Myths and theories that need to be addressed are done so in these statistical tables, one of the most accurately touched on is the idea that players who give away fewer free kicks will be viewed favorably in the umpires eyes come vote submission time. Nathan Fyfe is the only anomaly in the data, being the only the Brownlow medal winner in the last six years to have given away more free kicks than he received. Although this isn’t exactly definitive, the suggestion that players of a ‘fairer’ within the rules mold are favored by the umpires is extremely credible.
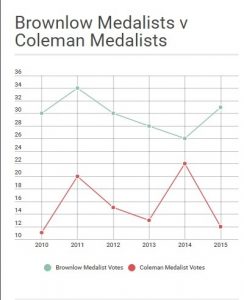
The argument that has always and will always pop up in any Brownlow discussion is that the medal is unfairly tailored and biased toward midfielders. The argument barely needs any statistics to back this up, but too really emphasis how askew the results are, we only need to look at Brownlow medal votes amongst Coleman medal winners between 2010 and 2015 (See graph below). Aside from Lance Franklin, who is a hybrid forward with the ability to amass possessions up the ground, no Coleman Medal winner in this time frame has gathered more than 15 possessions which is an extremely poor showing. For example, Josh Kennedy kicked 82 goals in 22 games to only be rewarded with 12 votes…
With the use of this statistical analysis we can comfortably support the hypothesis that there is a leaning toward players who give away less free kicks than they receive and can also comfortably conclude that the Brownlow Medal is a midfielder’s award, with forwards scarcely receiving the attention they deserve from the umpires. We can also assume, with the assistance of statistical history, that a player will need to be averaging over 27 disposals and in most recent years, will need to be averaging over 14 contested disposals for the season to take home Charlie.
METHODOLOGY
Having had difficulty finding a data set that with a deep enough set of statistics, I created my own dataset, incorporating data from reputable football site footywire.com and also through contacts at champion data.
I took all the data possible back until 2010, due to this being the most accurate – also due to the fact that the game has taken a change since the turn of the decade, making this dataset more reliable for the arguments that are being presented.