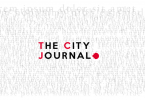
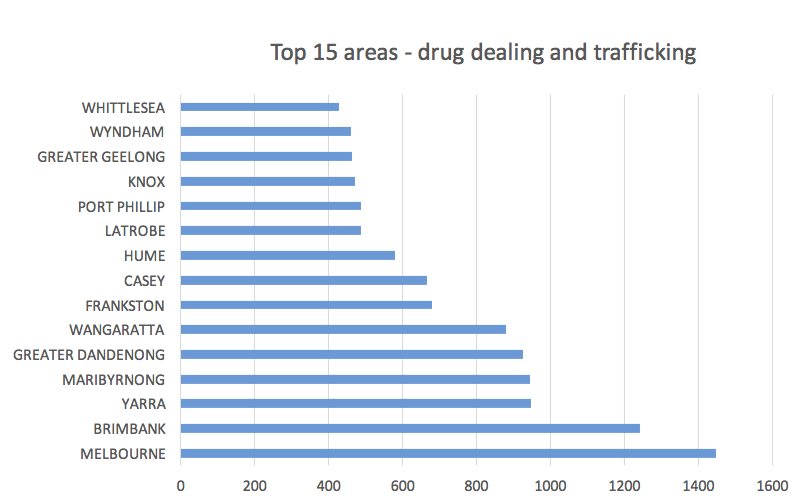
Data released by the Crime Statistics Agency in for offences from April 2010 to March 2015 shows 7.16% of cultivate or manufacture drug offences were recorded in the municipality of Brimbank, Victoria.
The local government area incorporates suburbs such as Sunshine, St Albans and Deer Park.
Brimbank comes in at 2.47% above Casey, in which we find suburbs such as Cranbourne, Endeavour Hills and Hampton Park.
On September 17 2015, The Age reported the average male Victorian prisoner has a history of drug/alcohol abuse.
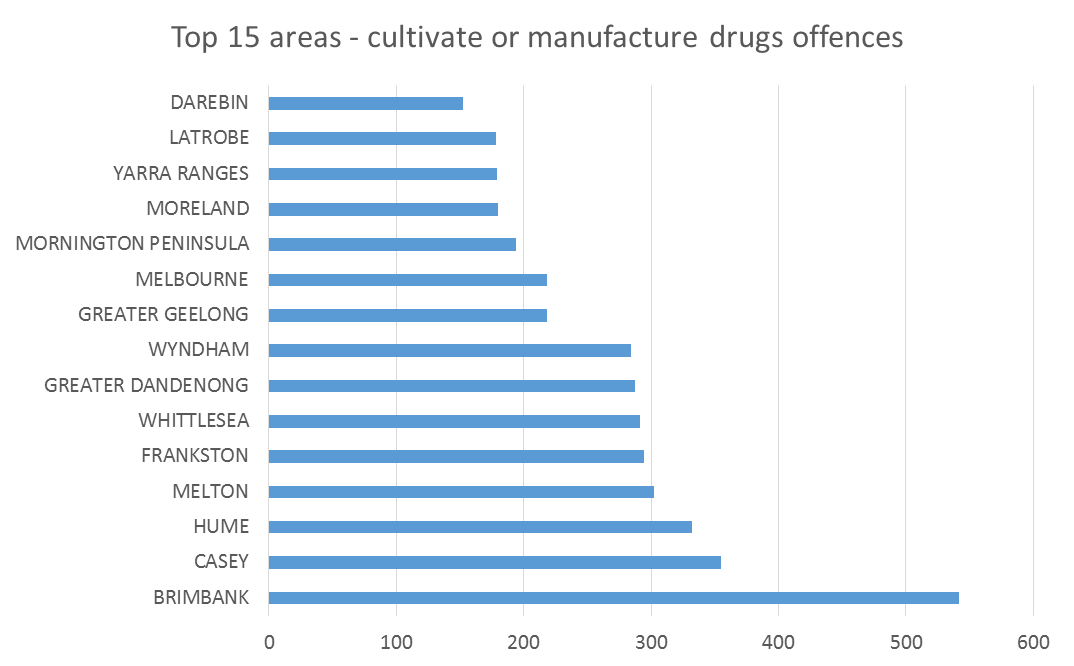
9.34% of drug use and possession offences were recorded in the Melbourne CBD – not surprising given the amount of nightspots and sheer population and police prescience in the city.
But the second and third municipalities with the most possession and use offences is Greater Dandenong and Brimbank – both of which appear in the top 15.
It seems drugs are being manufactured in or close to areas in which their use is heavy, which would naturally increase the amount of dealing and trafficking charges too.
Drug offences lead the charge in the 10.3 per cent rise of Brimbank’s overall crime rate in the 12 months to December 2012, as reported by the Brimbank Leader.
These figures show just how much of a problem drugs are for Brimbank.
Earlier this month, the Brimbank Leader reported the Andrews government will fund several community grants with the hope of boosting safety in Sunshine and St Albans.
The grants will provide funds for the installation of extra lighting, an outreach program aimed at Sudanese youth and a weekly soccer clinic to engage young people.
But the crime data shows Brimbank’s troubles run much deeper – it is the only municipality to appear in the top three for drug manufacture/cultivation, dealing/trafficking and use/possession offences.
And while locals are also doing their bit to decrease anti-social behaviour, by organising community events such as outdoor movie screenings, the latest crime statistics show an uphill battle to turn the suburb around.
New laws aimed at taking illegal guns off the streets were introduced to State Parliament in August, following a 56 per cent jump in firearm offences in the north-west over a four-year period.
There is some success however, police data released in 2014 showed a 4.9 per cent drop in the overall crime rate compared to the previous year.
Crime data for the 2014 – 2015 financial year will be released by the CSA on October 1.
Perhaps there is still hope for one of Victoria’s most drug-riddled municipalities.
Methodology:
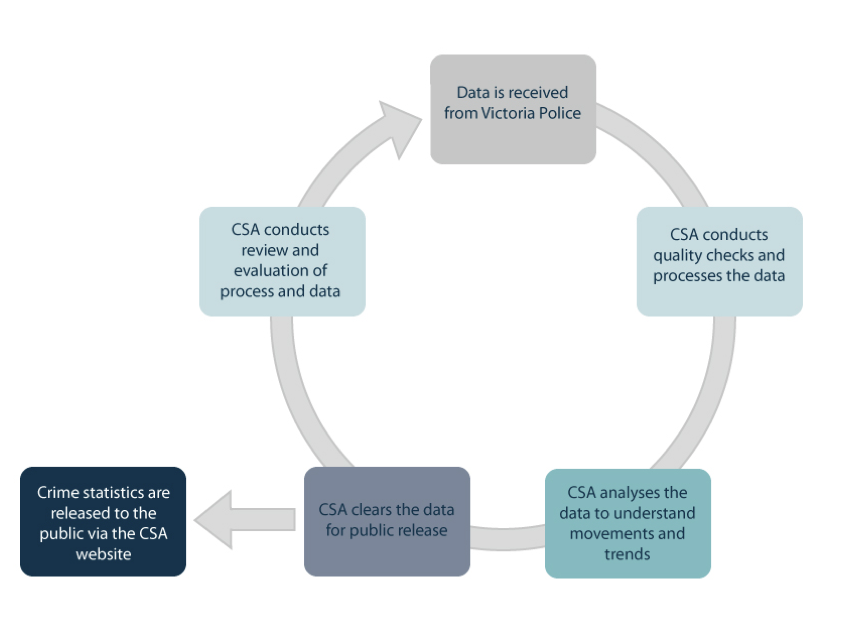
Victoria Police officers respond to many call outs and crime reports on a daily basis across the whole state.
The data of the crimes they attend is entered into their computer system.
As the below diagram from the Crime Statistics Agency explains, the raw data is lifted from the computer system, processed, and released to the public.
Crime data can shed so much light on what is happening in our state, by allowing us to pinpoint crime hotspots to geographical locations.
My article was constructed by utilising the crime data and interpreting it using a Pivot Table on Microsoft Excel. I was then able to filter and sort the results and generate charts.
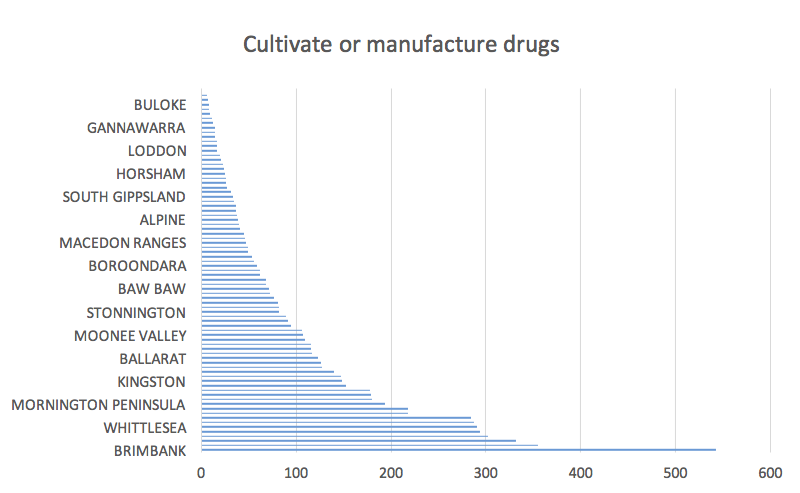
The below chart shows the data for all the municipalities and helps put everything into context.