It is no secret that Australians have always enjoyed their alcohol. From a glass of wine after work, a beer at the pub or spirits on a night out- the perception is that in most social situations, alcohol is involved.
But, new data tells us this outlook is not exactly true now. We are actually drinking the fewest litres per capita since the early 1960s.
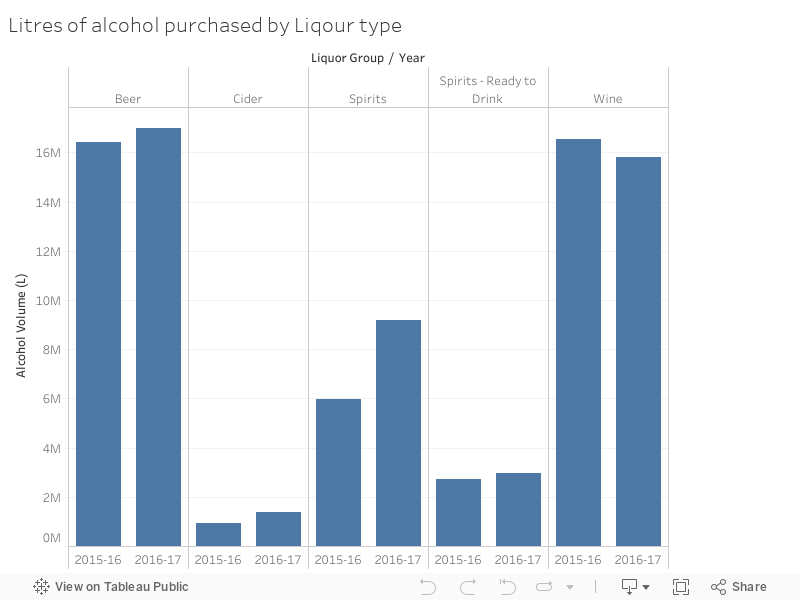
The visualisations in this article are based on litres of pure alcohol. Pure alcohol is a liquid organic compound, when fermented with fruits and grains, becomes distilled ethanol, found in ‘liquor’. Serves of beer, wine, cider and spirits are classified in the data as ‘liquor’.
One more significant point of interest is the beer trend line. In 2014-15, Australian’s purchased 3.87 litres per person. Australia also purchased 3.87 litres per person in another year- in 1945-46, at the end of World War II.
Why are we drinking differently?
There are a few reasons why this trend is developing. ‘Changing attitudes to alcohol in Australia’ (2017), by Michael Livingston from LaTrobe University, found the percentage of the population naming alcohol as the drug causing the most deaths rose from 22.7 per cent in 2001 to 34.2 per cent in 2013, and rose again to 35 per cent in 2016 (Australian Institute of Health and Welfare).
Livingston says “Australian attitudes to alcohol became more conservative between 2001 and 2013”, and trends in community attitudes were similar across “all demographics”.
The AIHW provides more possible reasons why Australian’s are drinking less in its 2016 ‘National Drug Strategy Household Survey’. The report found 48 per cent of recent drinkers ‘took action to reduce their alcohol intake’ in 2016, due to health concerns and social reasons. It also says young people, aged between 25 and 29, were the most likely to take action to reduce their alcohol intake.
How does Victoria fare?
Victoria is the lowest in the country when it comes to alcoholic drinks per week, Medibank’s Better Health Index says. Victorian’s drink around 9.79 drinks per week, on the other end of the scale, Queenslander’s drink around 11.14.
In terms of the types of drinks we buy, beer and wine are fairly equal, and there has been an increase in the purchase of spirits, in data found from Victoria’s Government.
This maps show alcohol purchases for 2016/17, by local government area, breaking down the data a different way.
Here we see how diverse Victoria is with it’s drinking habits- as is Australia. But, overall our attitudes are changing towards alcohol, despite what we might think or understand about how we drink.